plotly.jsのVue用パッケージを公開しています
PythonやRのデータ可視化で知られているPlotlyですが、 そのJavaScriptの部分(plotly.js)をVueアプリから使いやすいようにVueコンポーネント化しました。PythonやR無しでPlotlyのチャートを表示できます。AstroのSSGページにも対応しました。
PlotlyのVueコンポーネント化の背景
Section titled “PlotlyのVueコンポーネント化の背景”PlotlyはJupyterLab(以前のJupyter Notebook)やDashを使ってデータを可視化するPython(あるいはR)のライブラリです。ブラウザ上ではplotly.jsがグラフを表示します。
Plotlyのデータ可視化機能を備えた本格的なWebアプリケーションを作るために、フロントエンドのフレームワーク用にコンポーネントがあると便利です。React用は公式からnpmパッケージが出ているのでそれを使えばよいですが、Vue用ではTypeScriptに対応しているものが無さそうでしたので、自作してnpmに公開しました。
PlotlyのVueコンポーネントの使い方
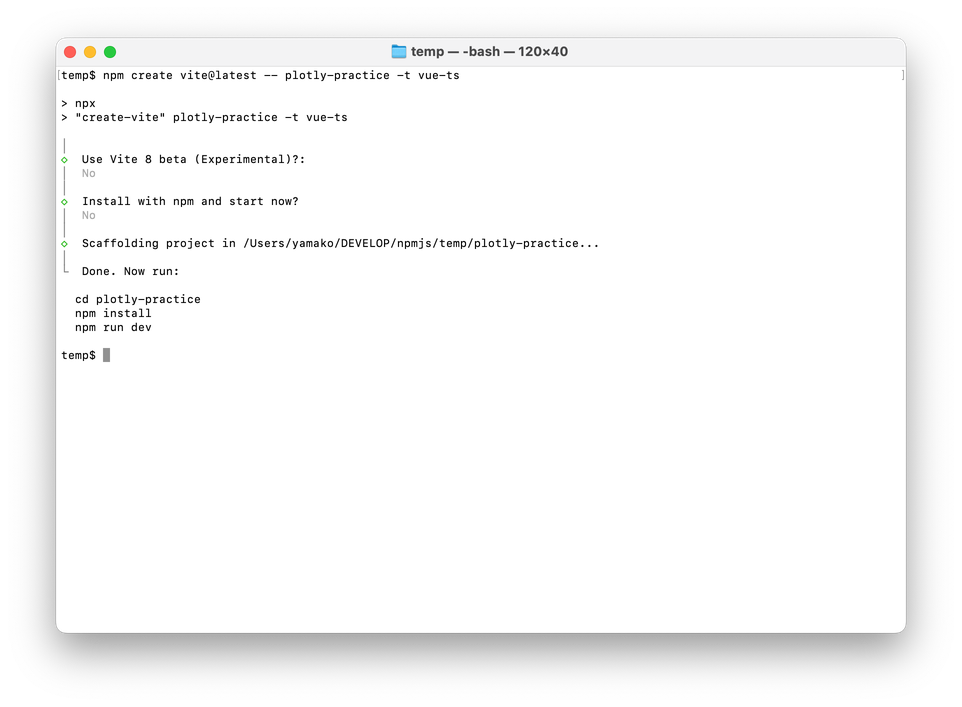
Section titled “PlotlyのVueコンポーネントの使い方”ターミナル上で、練習用のVueプロジェクトを作って使い方を説明します。
cd <作業フォルダー>npm create vite@latest -- plotly-practice -t vue-tsターミナル画面の詳細
npmで @yamakox/vue3-plotly パッケージをインストールします。
cd plotly-practicenpm install --save @yamakox/vue3-plotly plotly.js-dist-minTypeScriptでは、Plotlyの型定義やVueコンポーネントの型ヘルパーモジュールもインストールしておきます。
npm install --save-dev @types/plotly.js-dist-minnpm install --save-dev vue-component-type-helpersVisual Studio CodeやCursorなどのコードエディタでplotly-practiceを開きます。
ファイル一覧からApp.vueを選択し、以下の内容で置き換えてください。
<script setup lang="ts">import Plot from '@yamakox/vue3-plotly'import Plotly from 'plotly.js-dist-min'
const x = Array.from({ length: 21 }, (_, i) => 2 * Math.PI * i / 20)
const data: Plotly.Data[] = [  { x: x, y: x.map(x => Math.sin(x)), type: 'scatter', mode: 'lines+markers' }]
const layout: Partial<Plotly.Layout> = {  title: { text: '波形の表示', font: { size: 20 } },  width: 600, height: 400, showlegend: false,}</script>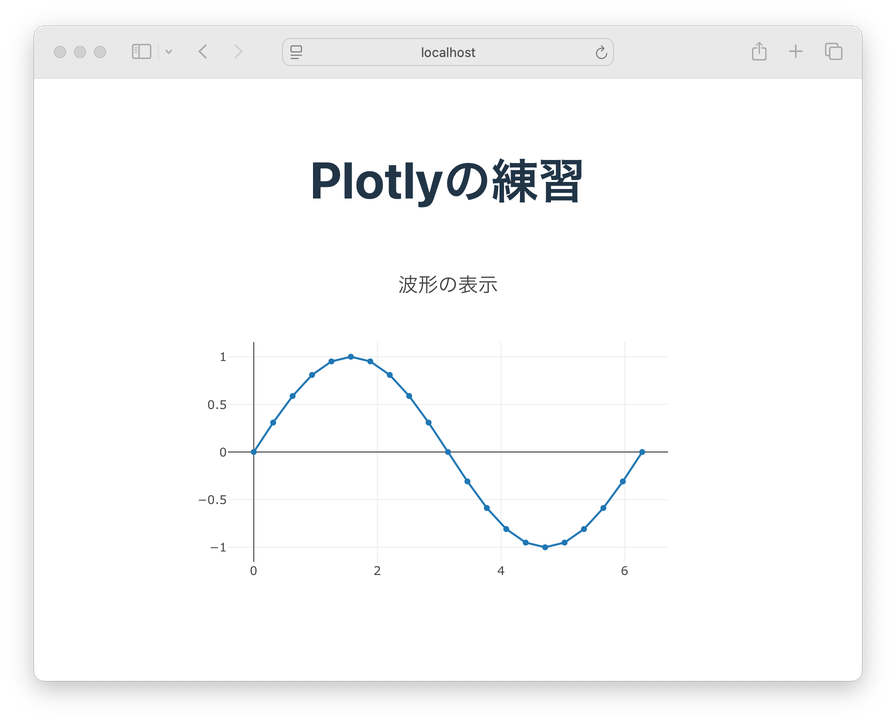
<template> <h1>Plotlyの練習</h1> <plot ref="plot1" :data="data" :layout="layout" /></template>ターミナルでnpm run devを実行してブラウザでhttp://localhost:5173を開くと、Plotlyの練習画面が表示されます。
Plotlyの練習画面
ブラウザは開いたままの状態でApp.vueに波形の追加ボタンを追加します。
<script setup lang="ts">import Plot from '@yamakox/vue3-plotly'import Plotly from 'plotly.js-dist-min'import { useTemplateRef } from 'vue'
import type { ComponentExposed } from 'vue-component-type-helpers'const plot1 = useTemplateRef<ComponentExposed<typeof Plot>|null>('plot1')
const x = Array.from({ length: 21 }, (_, i) => 2 * Math.PI * i / 20)const x = Array.from({ length: 101 }, (_, i) => 2 * Math.PI * i / 100)
const data: Plotly.Data[] = [  { x: x, y: x.map(x => Math.sin(x)), type: 'scatter', mode: 'lines+markers' }  { x: x, y: x.map(x => Math.sin(x)), type: 'scatter', mode: 'lines' }]let n = 1
const layout: Partial<Plotly.Layout> = {  title: { text: '波形の表示', font: { size: 20 } },  width: 600, height: 400, showlegend: false,}
function addTrace() {  n += 1  plot1.value?.addTraces([    { x: x, y: x.map(x => Math.sin(n * x)), type: 'scatter', mode: 'lines' }  ])}</script>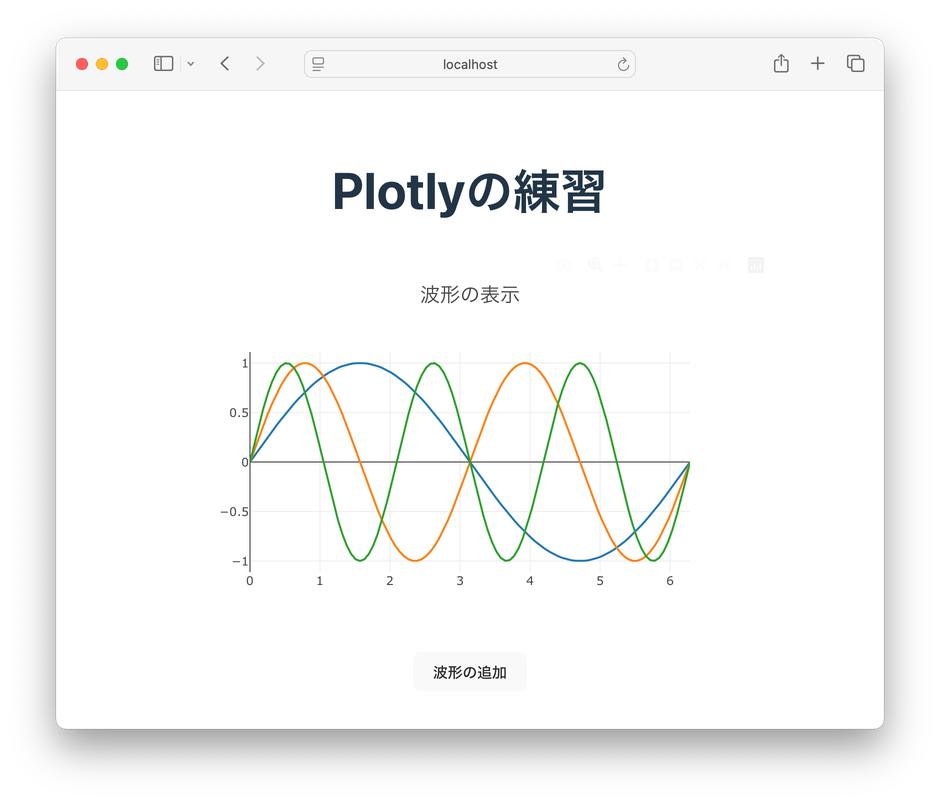
<template> <h1>Plotlyの練習</h1> <plot ref="plot1" :data="data" :layout="layout" /> <button @click="addTrace">波形の追加</button></template>Viteの高速なHMR(Hot Module Replacement)のおかげで、実行した状態のままで動作を変更できるのはとても助かります。
App.vueを上書き保存すると、ブラウザに波形の追加ボタンが表示されます。2回クリックすると波形が3つ表示できていれば正常に動作しています。
「波形の追加」ボタンの詳細
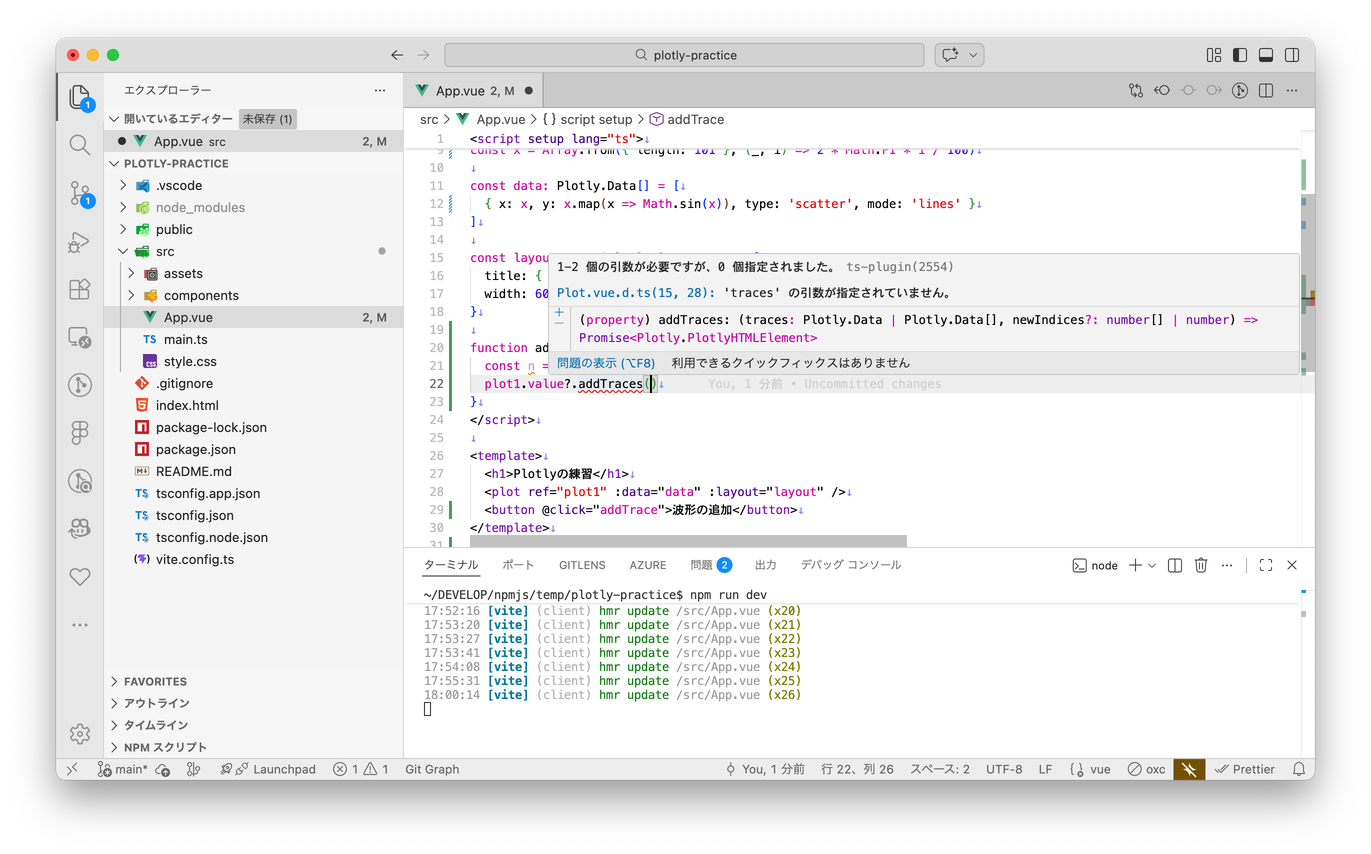
ソースコードの入力中には、Plotコンポーネントのメソッドの型を確認することができます。
AstroのSSG/SSRページでの使い方(client:onlyが必要)
Section titled “AstroのSSG/SSRページでの使い方(client:onlyが必要)”本記事の先頭に表示しているメキシカンハットはPlotコンポーネントで実装しています。
本記事はAstro Starlightで作成していますが、アイランドアーキテクチャによってVueコンポーネントをクライアントアイランドで表示しています。
Astroはビルド時にコンポーネントをHTMLとCSSのみへレンダリングするため、
クライアントサイドのJavaScriptを使うPlotlyでは client: ディレクティブを指定することが必須です。
Plotコンポーネントの場合、client:loadではAstroのビルド時にエラーが発生するため、 client:only="vue" を指定して、サーバー側でのレンダリングを行わないようにします。
メキシカンハットのサンプルコード
---title: "タイトル"description: "説明"---import Plot from '@yamakox/vue3-plotly'
export function getData() {  const size = 1  const zscale = 0.8  const data = [    { x: [], y: [], z: [], type: 'scatter3d', mode: 'markers', marker: {size: size, color: 'rgb(  0,   0, 255)'} },    { x: [], y: [], z: [], type: 'scatter3d', mode: 'markers', marker: {size: size, color: 'rgb(255,   0,   0)'} },    { x: [], y: [], z: [], type: 'scatter3d', mode: 'markers', marker: {size: size, color: 'rgb(255,   0, 255)'} },    { x: [], y: [], z: [], type: 'scatter3d', mode: 'markers', marker: {size: size, color: 'rgb(  0, 255,   0)'} },    { x: [], y: [], z: [], type: 'scatter3d', mode: 'markers', marker: {size: size, color: 'rgb(  0, 255, 255)'} },    { x: [], y: [], z: [], type: 'scatter3d', mode: 'markers', marker: {size: size, color: 'rgb(255, 255,   0)'} },    { x: [], y: [], z: [], type: 'scatter3d', mode: 'markers', marker: {size: size, color: 'rgb(255, 255, 255)'} },  ]  const range = (start, stop, step) => Array.from(    { length: Math.ceil((stop - start) / step) },    (_, i) => start + i * step,  )  range(-180, 180, 6).forEach((x) => {    range(-180, 180, 6).forEach((y) => {      let r = Math.PI * Math.sqrt(x * x + y * y) / 180      let z = 100 * Math.cos(r) - 30 * Math.cos(3 * r)      let zz = Math.trunc((z + 100) * 0.035) + 1      let color = 0      if ([1, 3, 5, 7].includes(zz)) color |= 1      if ([2, 3].includes(zz) || zz >= 6) color |= 2      if (zz >= 4) color |= 4      if (color > 0) {        let trace = data[color - 1]        trace.x.push(x)        trace.y.push(y)        trace.z.push(z * zscale)      }    })  })  return data}
export const layout = {  width: 400, height: 300, showlegend: false,  margin: { t: 0, r: 0, b: 0, l: 0 },  paper_bgcolor: 'black',  hovermode: false,  scene: {    xaxis: {visible: false},    yaxis: {visible: false},    zaxis: {visible: false},    camera: {      eye: {x: .9, y: 1.3, z: .4},      center: {x: 0, y: 0.1, z: -0.2},      up: {x: .2, y: 0, z: 1},    },    dragmode: 'orbit',  },}
<Plot client:only="vue" data={getData()} layout={layout} />.plot-container.plotly * { /* * @layer starlight.contentの以下の定義が * Plotlyのボタンやチャートのツールチップなどに適用されてしまうため、これを無効化する。 * * .sl-markdown-content * :not(a, strong, em, del, span, input, code, br) * + :not(a, strong, em, del, span, input, code, br, :where(.not-content *)) { * margin-top: var(--sl-content-gap-y); * } */ margin-top: 0;}蛇足: v0.3.0での対策
Section titled “蛇足: v0.3.0での対策”当初はclient:onlyを指定しても、ビルド時にimport Plot from '@yamakox/vue3-plotly'の中でplotly.jsのクライアント側JavaScriptが呼び出されてしまってエラーが起きていたのですが、ブラウザがコンポーネントをマウントしたタイミングでplotly.jsをインポートするように修正したところ、正常にビルドできるようになり、ブラウザでグラフを表示できるようになりました✨